2.4 Data Monitoring
The data was recorded in StarLogo. A table of data and graph were generated each time the model was run. When the number of dropouts reached 10% of student population or in this model 16 dropouts, the model would be manually stopped. The data was then saved into Excel for compiling and analyzing the results.
The data was recorded in StarLogo. A table of data and graph were generated each time the model was run. When the number of dropouts reached 10% of student population or in this model 16 dropouts, the model would be manually stopped. The data was then saved into Excel for compiling and analyzing the results.
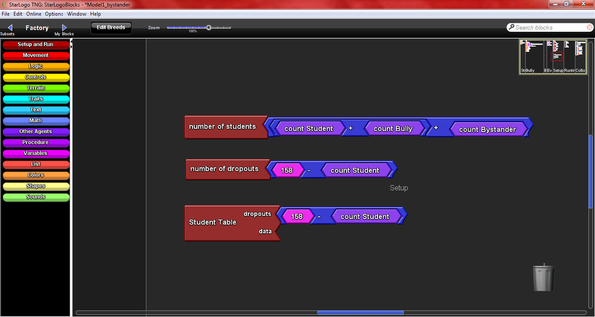
Figure 20 Bystander Data Monitoring Blocks
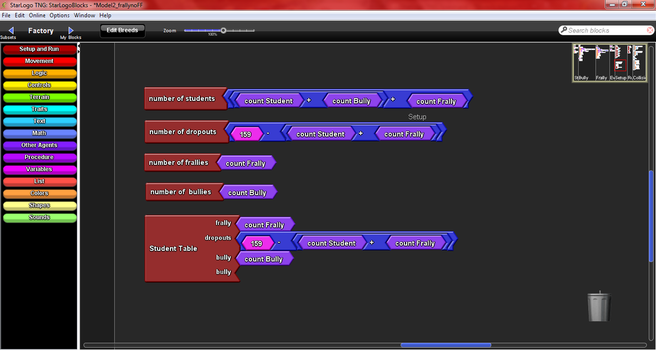
Figure 21 Frally Data Monitoring Blocks
The following is an example of a StarLogo graph. It records the change in populations for the different agents.
The following is an example of a StarLogo graph. It records the change in populations for the different agents.
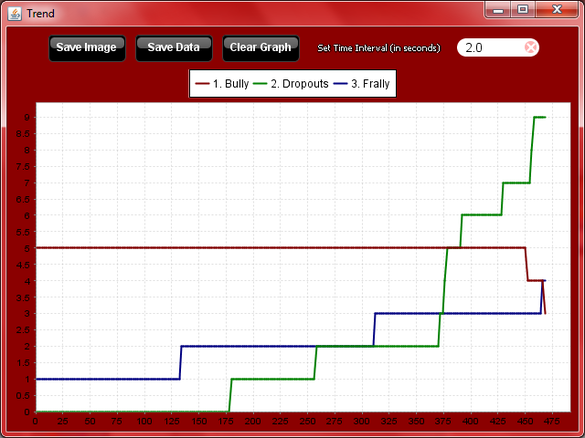
Figure 22 Starlogo Graph
Figure 23 shows the data from StarLogo taken every 2 intervals. Once the number of dropouts reached 16,
the user would stop the model and record the data.
the user would stop the model and record the data.
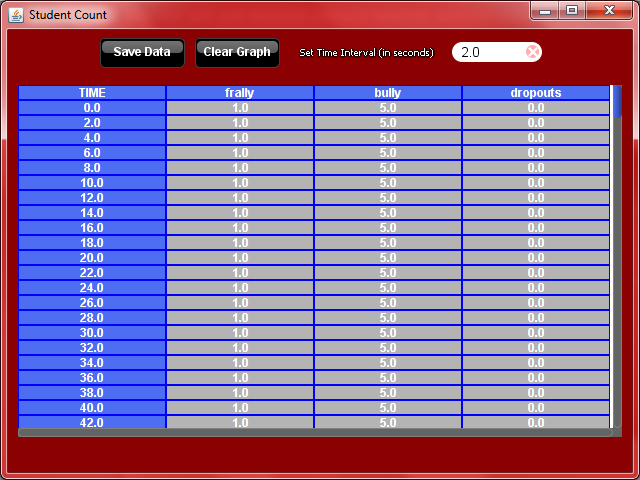
Figure 23 StarLogo Table
The data was also saved into Excel for further analysis as seen in Figure 24.
The data was also saved into Excel for further analysis as seen in Figure 24.

Figure 24 Excel Table

